Now we have our conky configured we can start on the fun part, first you need to decide what you want to display with your conky, in my case I first wanted to show my CPU usage and temperatures/fans as well as some basic network and memory information.
I started by getting some basic data from the system, number of cpu cores, network device id and using sensors I was able to see what other information I could use. If you want more information on lm-sensors (the sensors command) then please read Finding Sensor Information.
Armed with this information I can now start to pick the objects I want displayed, if you look at the conky manual (from a terminal type man conky) you can scroll down to the section OBJECTS/VARIABLES and you can look through all the available choices, but if you are new to conky you might find this a bit of “information overload” and want a few pointers first, so continue with this guide and then they might make easier reading.
After searching the Objects list I found I wanted to display these things
- Current percentage of cpu used for each core (two in this guide)
- Current speed for each core (I have speed stepping enabled)
- Current temperature for each core
- Graph to display core percentage (scrolling)
- Memory statistics (percent used, amount free amount used)
- Same as Memory information for the swap partition
- Network upload/download current speed and total values
- Public IP address
- Private IP address
The objects/variables I want to use for these are :-
- ${cpu cpu1} ${cpu cpu2}
- ${freq 1} ${freq 2}
- ${hwmon 1 temp 2} ${hwmon 1 temp 3}
- ${cpugraph cpu1 30,254 00FF00 FF0000 -t} ${cpugraph cpu2 30,254 00FF00 FF0000 -t}
- ${memperc} ${memeasyfree} ${mem}
- ${swapperc} ${swapfree} ${swap}
- ${downspeed enp3s0} ${upspeed enp3s0} ${totaldown enp3s0} ${totalup enp3s0}
- ${execi 300 dig +short myip.opendns.com @resolver1.opendns.com}
- ${addrs enp3s0}
To get the parameters for the hwmon objects at line 3 see this short guide and if you are using a proxy for internet access you might not get the correct results using line 8 as this is how I get my external IP address which may be masked (hidden or changed). And for obtaining the network card ID you could view another short guide which gives you a simple way to find it (or them).
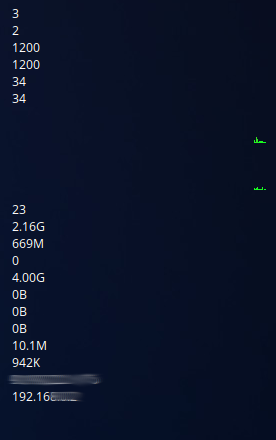
After adding these to my conky the text area will look like this :-
conky.text = [[
${cpu cpu1}
${cpu cpu2}
${freq 1}
${freq 2}
${hwmon 1 temp 2}
${hwmon 1 temp 3}
${cpugraph cpu1 30,254 00FF00 FF0000 -t}
${cpugraph cpu2 30,254 00FF00 FF0000 -t}
${memperc}
${memeasyfree}
${mem}
${swapperc}
${swapfree}
${swap}
${downspeed enp3s0}
${upspeed enp3s0}
${totaldown enp3s0}
${totalup enp3s0}
${execi 300 dig +short myip.opendns.com @resolver1.opendns.com}
${addrs enp3s0}
]]
And this results in the conky looking like this :-
I start by editing the config section to turn on the graph borders (see Part 1) and then proceed to move the items to where I want them to be. I want the cpu graphs at the top of the list so they will become line 1 & 2, after restarting my conky I can see there is a larger gap at the top than I want so I move the first graph up with the ${voffset} instruction. After trying a few different values I end up with a value of -8 which I place at the beginning of my text section like this :-
conky.text = [[
${voffset -8}${cpugraph cpu1 30,254 00FF00 FF0000 -t}
${cpugraph cpu2 30,254 00FF00 FF0000 -t}
I placed it on the same line as the graph because each line in the conky (even if it displays nothing) will enter a new line in the display.
To explain the cpugraph parameters we can look at “man conky” and scroll to the desctiption and it will show this
cpugraph (cpuN) (height),(width) (gradient colour 1) (gradient colour 2) (scale) (-t) (-l)
I have used the cpuN (cpu number), height, width, gradient colour 1 and 2 and the -t (temperature) switch. You can adjust the colours using either hex codes or standard colour names, but you will need to check the colour name you want actually displays what you are expecting it to.
Next I adjust the second graph position using the same method and end up with a value of -11, this aligns it to my preference and you can adjust your own to fit your needs.
I want the cpu percentage value to be in bold text so I add this before the percent call and place the cpu percentage over the top of the graph, this is done the same way as you previously moved the graph, I ended up with the value of -80. I also want the percent sign to be displayed which is simple text which can be added (with a space if preferred) and the instruction looks like this :-
${voffset -80}${font DejaVu:bold:size=11} ${cpu cpu1} %${font}
Notice the space before the cpu call and between that and the percent sign, this is to make it look better (IMO). I also reset the font to default at the end by using the ${font} object with no parameters.
I want the cpu frequency displayed next and move that line to the same line as (and after) the percentage, I need to move it towards the middle of the graph and after testing a few values decide that it should start at pixel 80 and use the goto object to place that value there and add Mhz after it to denote it’s value. That line now looks like this :-
${voffset -80}${font DejaVu:bold:size=11} ${cpu cpu1} %${font}${goto 84}${freq 1} Mhz
The last piece of information I want to be displayed over the graph is the temperature, I use the hwmon object for this although you may have to try another method if you cannot find the temperature you want to see. After a little trial and error I found the values I wanted and entered them and added a degree symbol. This time I used the alignr object (align to the right) to place this value to the right edge of the conky and added a 15 pixel indent (from the right) to prevent it displaying over the edge of the screen.This is the first graph done and the line now looks like this :-
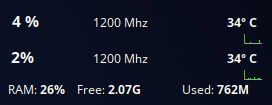
${voffset -80}${font DejaVu:bold:size=11} ${cpu cpu1} %${font}${goto 84}${freq 1} Mhz${alignr 15}${font DejaVu:bold:size=9}${hwmon 1 temp 2}° C${font}
Notice I again changed the font to bold for the temperature and reset the font back to normal at the end, the display now looks like this :-

Now go through the same process to align the information over the second graph (and more if you have the cores), I ended up with this code :-
conky.text = [[
${voffset -8}${cpugraph cpu1 30,254 00FF00 FF0000 -t}
${voffset -11}${cpugraph cpu2 30,254 00FF00 FF0000 -t}
${voffset -80}${font DejaVu:bold:size=11} ${cpu cpu1} %${font}${goto 84}${freq 1} Mhz${alignr 15}${font DejaVu:bold:size=9}${hwmon 1 temp 2}° C${font}
${voffset 16} ${font DejaVu:bold:size=11}${cpu cpu2}%${font}${goto 84}${freq 2} Mhz ${alignr 15}${font DejaVu:bold:size=9}${hwmon 1 temp 3}° C${font}
And it looks like this :-

When you are happy with the position and layout of the cores you can start to position and format the rest of your objects.
start by using an offset to position the line below the graph, add some text “RAM: ” and then set the font (if you want it bold or different). Add the object (memperc) followed by a percentage sign “%” (just text) and then set font back to default. this gives me
${voffset 14}RAM: ${font DejaVu:bold:size=9}${memperc}%${font}
On the same line set the position to 74 (using goto) add some more text “Free: “set the font to bold and add the object “memeasyfree” a space, and reset the font again. this adds this section to the line
${goto 74}Free: ${font DejaVu:bold:size=9}${memeasyfree} ${font}
Still on the same line we can add the last section, again goto position 179, add some text (“Used: “), set font to bold, add the object “mem” and reset the font.
The complete line should look similar to this :-
${voffset 14}RAM: ${font DejaVu:bold:size=9}${memperc}%${font}${goto 74}Free: ${font DejaVu:bold:size=9}${memeasyfree} ${font}${goto 179}Used: ${font DejaVu:bold:size=9}${mem}${font}
Now we have a line below the graphs and have positioned it to our liking we can turn off the graph borders to see how it looks.
The next line will contain my swap information so I start with the text “Swap: ” and then change the font to bold, add the object ${swapperc} and place a percent sign after it and reset the font (can you see a pattern yet?). Next I place the text at pixel 74 (using ${goto 74}) and add the text “Free: ” change the font to bold, enter the object ${swapfree} and reset the font. Finally I place the text “Used: ” at pixel 179, change the font to bold, add the object ${mem} and reset the font. This gives us the following line :-
Swap: ${font DejaVu:bold:size=9}${swapperc}%${font}${goto 74}Free: ${font DejaVu:bold:size=9}${swapfree}${font}${goto 179}Used: ${font DejaVu:bold:size=9}${swap}${font}
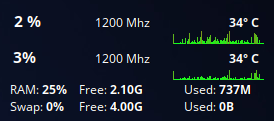
And when added to the conky it looks like this :-
Now we move on to the networking details, I start by putting in a header which is simple text with a small offset to give some separation.
${voffset 4}NETWORK
The next line will contain the current download speed and total, again we start with some text “Down Speed”, then move to pixel 79 and add some more text ” : “, this is to keep the colons aligned. Now we set the font to bold and add the object ${downspeed enp3s0} but you will need to replace the parameter “enp3so” with the network device ID that you want to get the data for, if you haven’t already got this information it can be obtained by following this short guide.
After that we need to reset the font and I use the ${alignr 15} object to place the download total at the right side of the conky and Put the text “Total: ” and then set the font to bold, enter the object ${totaldown enp3s0} and reset the font. This will give us the following line :-
Down speed${goto 79} : ${font DejaVu:bold:size=9}${downspeed enp3s0}${font} ${alignr 15}Total: ${font DejaVu:bold:size=9}${totaldown enp3s0}${font}
Now we can do the same with the upload speed and get this line :-
Up speed${goto 79} : ${font DejaVu:bold:size=9}${upspeed enp3s0}${font} ${alignr 15}Total: ${font DejaVu:bold:size=9}${totalup enp3s0}${font}
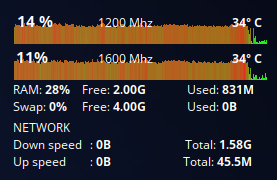
This all combined makes the conky look like this, and notice that the text in the cpu graphs will be placed above the graph lines due to it being “drawn” after the graphs in the conky, this makes it more readable during time when the cpu is busy. Also note the temperature colour gradient which changes due to the current level. (-t option in ${cpugraph} object)
This next line needs a little more explanation as it uses the execi object which will execute a command at a given interval, I have chosen to only get this information every 5 minutes as it requires getting information from the internet to confirm my external IP address. You can use the command (not the execi bit) directly in a terminal to ensure it gives you the correct information, and you will see it is usually pretty quick! You would need to use a little trial and error if you wanted to use a different command as not everything will be able to run as expected and bear in mind anything you put here you want to be able to complete the task in as short a time as possible to keep the conky running smoothly. I had to install the package dnsutils to make the dig command available.
${execi 300 dig +short myip.opendns.com @resolver1.opendns.com}
I have made this line more complex as I wanted to have an if statement to show if I didn’t have a network connection. I started with the ${if_gw} object which will return true if you have an open gateway to the internet (or local network)
${if_gw}
followed by what I want to display if I have a gateway open, in this case I use some text “Public WAN Address” then align text to the right with a 15 pixel shift ${alignr 15}, change the font to bold and issue the execi command to get my ip address, then reset the font.
Public WAN Address ${alignr 15}${font DejaVu:bold:size=9}${execi 300 dig +short myip.opendns.com @resolver1.opendns.com}${font}
Then comes an else object ${else} and then we put the information we want to display if no gateway is found which in this case is simple text “No WAN Connection Available” and then the endif object ${endif}
${else}No Wan Connection Available${endif
The complete line looks like this
${if_gw}Public WAN Address ${alignr 15}${font DejaVu:bold:size=9}${execi 300 dig +short myip.opendns.com @resolver1.opendns.com}${font}${else}No Wan Connection Available${endif}
Now I add the LAN address which is a simple object, and again you will need to replace the parameter with your own network device ID.
${addrs enp3s0}
And again I want to be sure there is a network connection and this time I check the file /proc/net/route contains information for my network device (enp3s0).
So I start by checking the file has the content
${if_existing /proc/net/route enp3s0}
and place the information I want to display if true (with formatting)
LAN Address${alignr 15}${font DejaVu:bold:size=9}${addrs enp3s0}${font}${voffset -4}
and this time I can simply end the if statement with ${endif} which will result in a blank line if no LAN connection is available. The full line is this
${if_existing /proc/net/route enp3s0}LAN Address${alignr 15}${font DejaVu:bold:size=9}${addrs enp3s0}${font}${voffset -4}${endif}
And finally I want to see my fan speeds, this is obtained using the hwmon object, if you haven’t already got your hardware sensor information you could read this short guide to get it. I use this information to display my fan speeds (2 of them) and leave one blank line to space them a bit lower than they otherwise would be.
Fan #2 Speed${goto 120}${hwmon 0 fan 2} rpm
Fan #4 Speed${goto 120}${hwmon 0 fan 4} rpm
This is the end of the conky as far as the information goes, but there is one more thing I usually do to prevent the conky from overlapping any others I put on my screen (Part three of this tutorial will cover storage display) and that is to ensure the overall length is not too long, to do this I turn off transparency in the config settings by commenting out these three lines (put double dash — at beginning of these lines)
own_window_transparent = true,
own_window_argb_visual = true,
own_window_argb_value = 0,
and when i run the conky it looks like this

As you can see the length of this conky is longer than the displayed information, if I then put another conky underneath it I would have issues with the overlapped area. To solve this I simply make the next line (with no data) move up, the amount to move it will vary depending on exactly how you have formatted the information but in my case a value of -100 will work, so the final two lines of this conky look like this
${voffset -100}
]]
The two closing brackets simply close the TEXT section and anything entered after this will not be displayed but may cause errors in your conky, so it is best to not put anything after this.
Building a conky Part 3 will demonstrate how to get HDD activity, partition sizes and display it in different ways.